
As a seasoned trader, I’ve witnessed firsthand the transformative power of candlesticks in technical analysis. Picture this: Amidst the relentless ebb and flow of market data, these enigmatic symbols emerge as silent storytellers, revealing cryptic patterns that can illuminate the path to trading success.

Image: howtotradeblog.com
But what exactly are candlesticks, and how can you harness their potential to decipher the complexities of the financial markets?
Understanding Candlesticks: A Visual Representation of Price Action
Candlesticks are a graphical representation of price movements over a specified period—a day, week, month, or even intraday timeframe. Each candlestick consists of a “body,” which represents the price range between the opening and closing prices, and one or two “wicks” or “shadows” that extend above and below the body, indicating the highest and lowest prices reached during the period.
The color of the candle body—white or green—indicates a bullish (upward) trend, while a black or red body signifies a bearish (downward) trend. By interpreting the patterns formed by these candlesticks, traders can gain valuable insights into market sentiment, price momentum, and potential reversal points.
Deciphering Candlestick Patterns: A Language of Market Behavior
Candlestick patterns are not merely static formations but rather dynamic expressions of market behavior. By studying their shapes, lengths, and relationships to neighboring candlesticks, traders can identify key trading opportunities.
Some of the most commonly recognized candlestick patterns include:
- Bullish Engulfing Pattern: A long green candle that completely engulfs a shorter red candle, indicating a strong reversal from a downtrend to an uptrend.
- Bearish Engulfing Pattern: A long red candle that completely engulfs a shorter green candle, signaling a potential reversal from an uptrend to a downtrend.
- Hammer Pattern: A candle with a small body and a long lower wick, indicating a potential reversal from a downtrend.
- Inverted Hammer Pattern: A candle with a small body and a long upper wick, suggesting a possible reversal from an uptrend.
- Doji Pattern: A candle with a small body and nearly equal wicks on both sides, representing indecision or a potential change in trend.
These patterns, combined with other indicators and technical analysis tools, can provide traders with valuable clues about market direction and potential trading opportunities.
Empowering Traders with Customized Trading Strategies
The mastery of candlestick analysis allows traders to develop tailored trading strategies that align with their risk appetite and investment objectives. By identifying specific candlestick patterns and combining them with other indicators, traders can optimize their decision-making and increase their trading accuracy.
For example, a trader may use a bullish engulfing pattern in conjunction with a moving average crossover to confirm a breakout from a downtrend and enter a long position. Conversely, a bearish engulfing pattern followed by a divergence in the MACD indicator may suggest a potential short-selling opportunity.
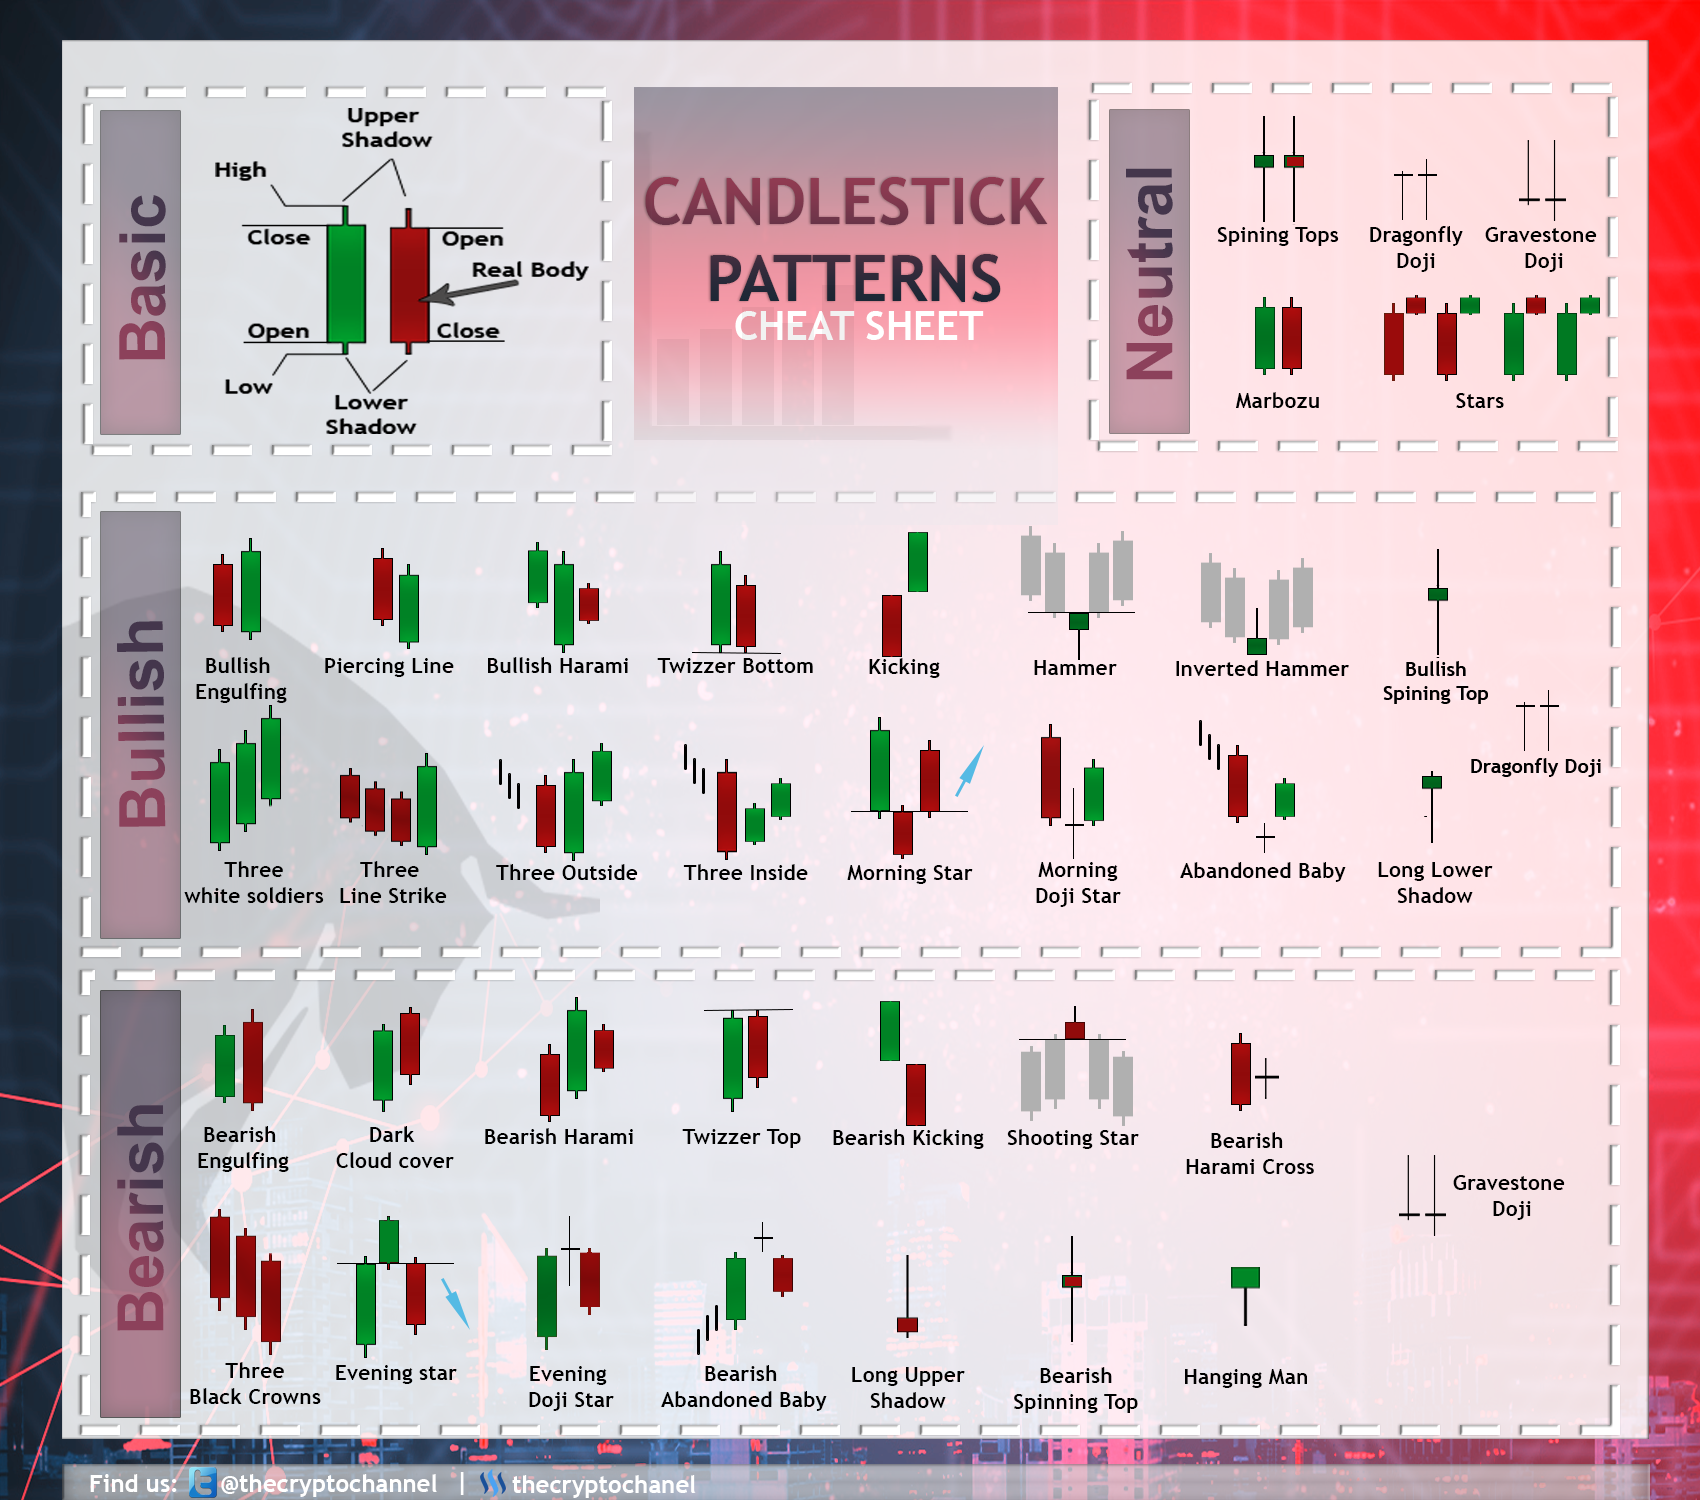
Image: elibook.vn
Harnessing the Power of Candlesticks: Tips and Practical Advice
1. **Master the basics:** Understanding the significance of candlestick components, such as body, wicks, and color, is crucial for effective candlestick analysis.
2. **Study historical patterns:** Examine past market data to identify how candlestick patterns have impacted price movements in various market scenarios.
3. **Combine multiple indicators:** Utilize additional technical indicators like moving averages, MACD, and Bollinger Bands to corroborate candlestick signals and enhance trading accuracy.
4. **Consider market sentiment:** Gauge investor sentiment through news, economic data, and market commentary to understand how emotions may influence candlestick patterns.
5. **Manage risk:** Risk management is paramount in trading. Place stop-loss orders to limit potential losses and consider trading positions with a positive risk-to-reward ratio.
Frequently Asked Questions (FAQs)
Q: Are candlesticks reliable trading indicators?
A: While candlestick patterns provide valuable insights, they are not foolproof indicators. They should be used in conjunction with other technical analysis tools and supplemented with a comprehensive understanding of market fundamentals.
Q: Can candlestick analysis be applied to all time frames?
A: Candlesticks can be employed across various time frames, from intraday charts to monthly or even yearly intervals. However, the effectiveness of candlestick patterns may vary depending on the time frame analyzed.
Q: Is candlestick analysis suitable for beginners?
A: While candlestick analysis can be initially challenging, it is accessible to beginners who are willing to dedicate time to learning the basics and gaining practical experience.
What Are Candles In Trading
Conclusion: Embracing Candlesticks for Trading Success
In the realm of trading, candlesticks have emerged as a powerful tool for discerning market dynamics and identifying trading opportunities. By studying candlestick patterns, grasping their implications, and implementing sound risk management practices, traders can elevate their trading performance and navigate the financial markets with greater confidence.
Embark on this captivating journey of candlestick analysis today and unlock the potential for trading success that lies within the flickering flames of these enigmatic formations.


