
In the heart of the financial markets, where fortunes are made and lost, there exists an enigmatic metric that holds the key to unlocking the pulse of market volatility—the Volatility Index, or VIX for short. Imagine a financial crystal ball that gauges the collective fear and uncertainty among traders, predicting the storm cloud’s approach or the sun’s golden rays.
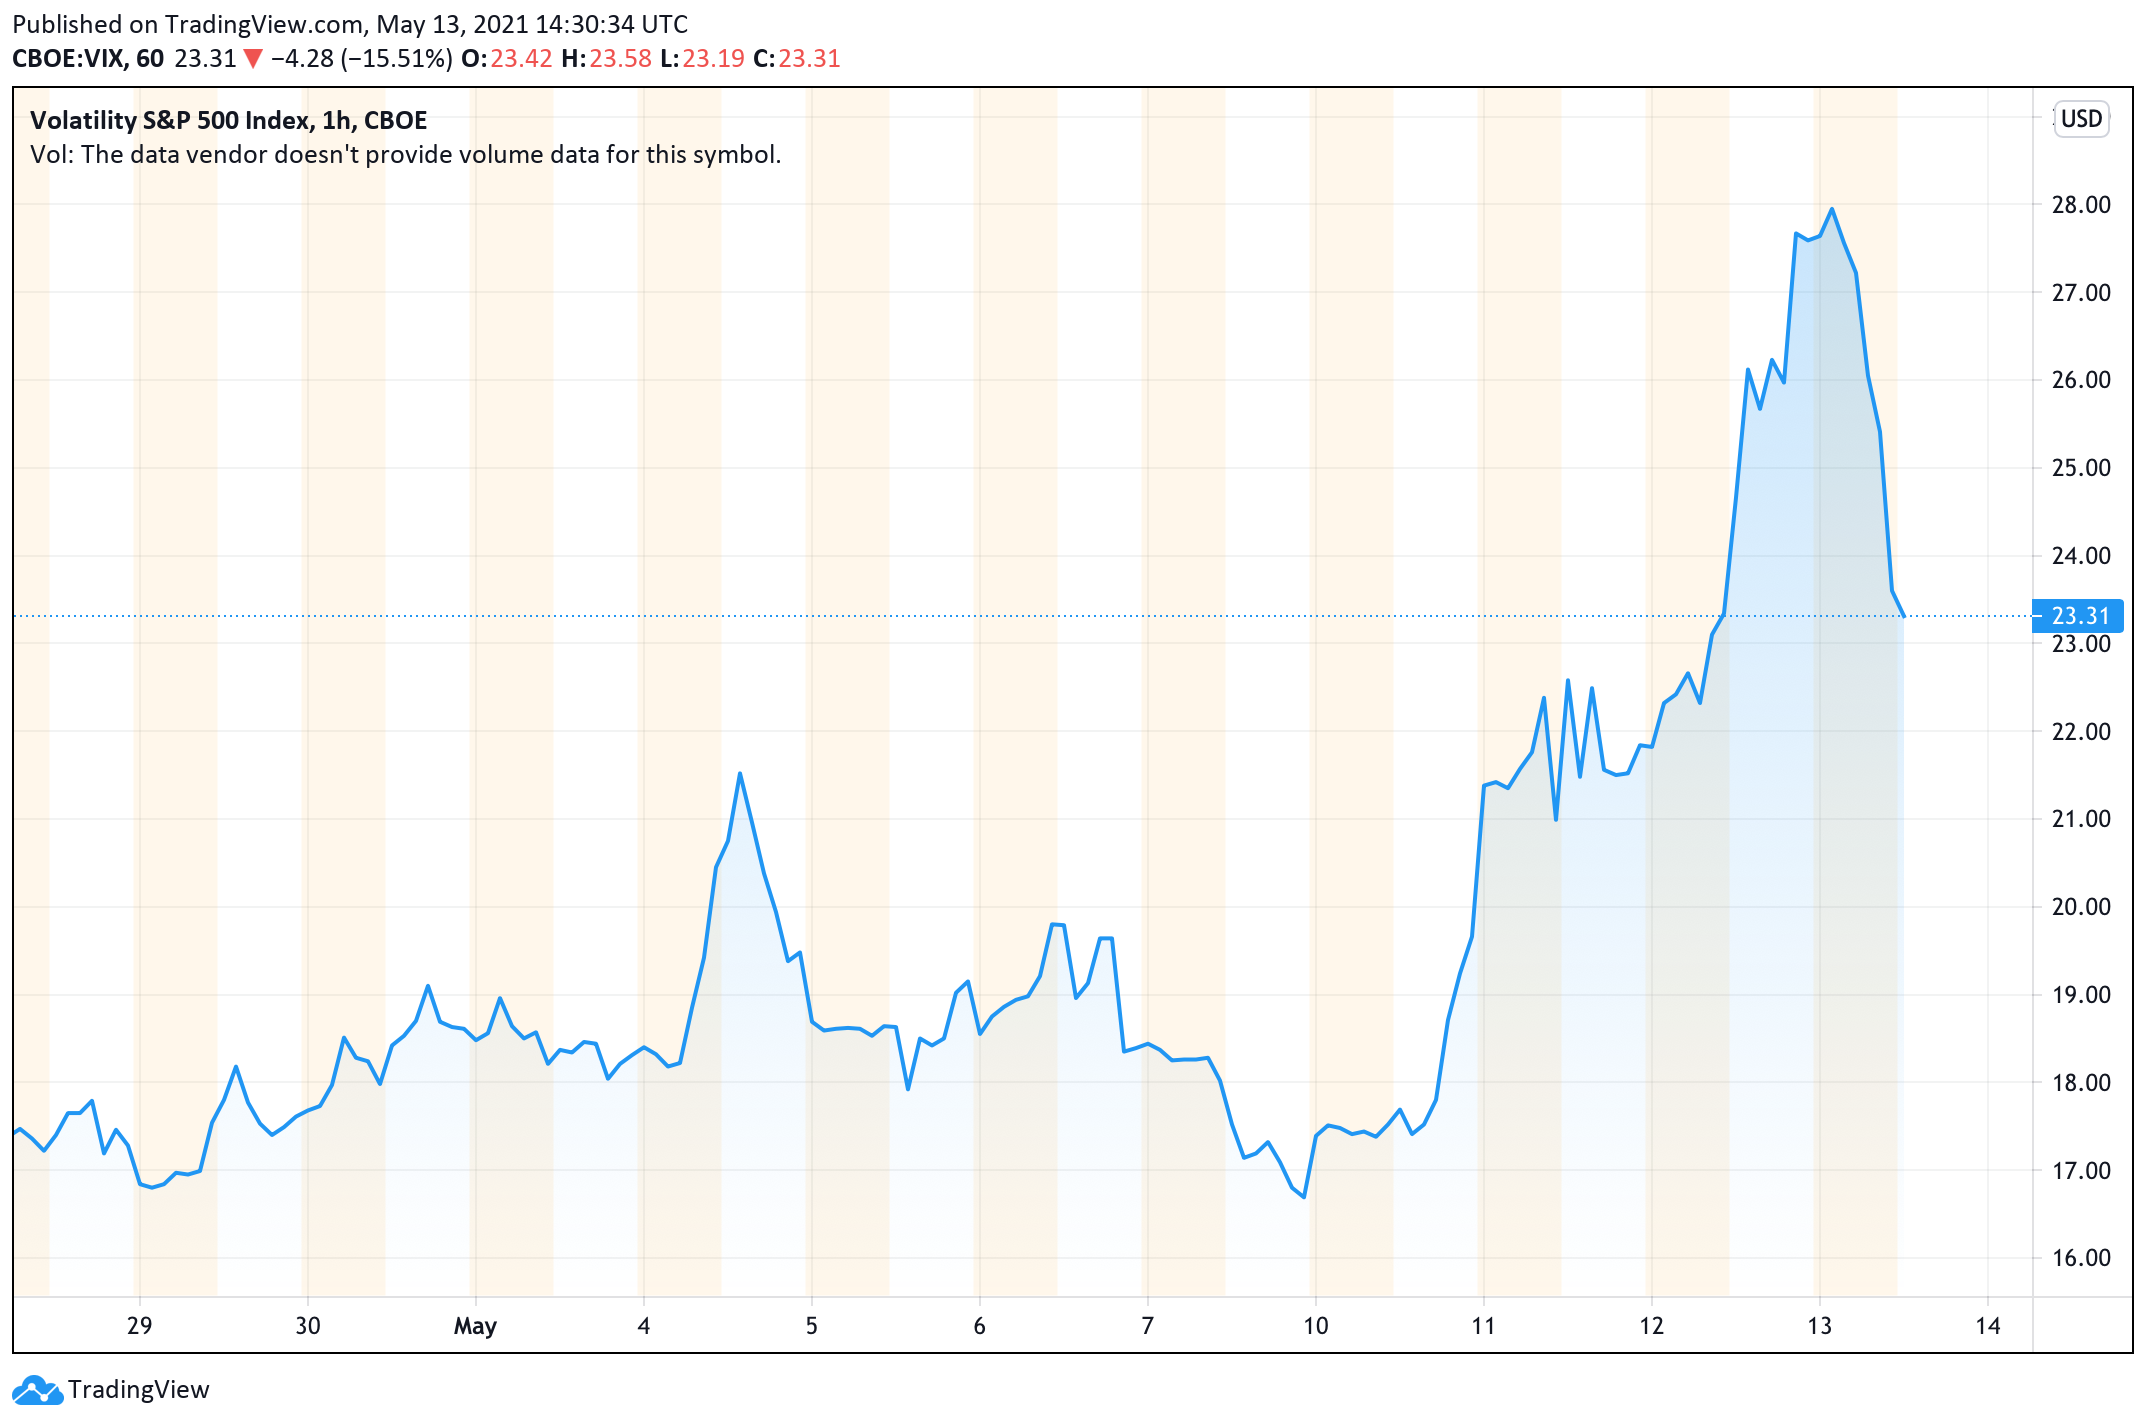
Image: news.bitcoin.com
No matter your investment journey, from novice to seasoned veteran, understanding the VIX is crucial for navigating the volatile waters of the markets. This comprehensive guide will delve into the fascinating world of the Volatility Index, deciphering its intricacies and empowering you with practical tips for leveraging its insights.
Peering into the Market’s Crystal Ball
At its core, the VIX is a forward-looking measure of the expected volatility in the S&P 500 index over the next 30 days. Think of it as a seismograph for the financial markets, providing a gauge of the ground tremors that might shake the investment landscape.
Calculated by the Chicago Board Options Exchange (CBOE), the VIX is derived from analyzing the prices of S&P 500 options, which are essentially financial contracts that allow traders to hedge against risk or speculate on future price movements. By crunching the numbers, the VIX effectively quantifies the market’s perception of risk and uncertainty.
The VIX: A Tale of Two Extremes
The VIX operates within a dynamic range, reflecting the ebb and flow of market sentiment. When the VIX is low, around 10 or less, it suggests a sense of calm and complacency among traders. The market is relatively stable, and the likelihood of significant price swings is perceived to be low.
On the other hand, when the VIX surges above 25, it signals heightened fear and volatility in the markets. Investors are jittery, and the odds of sharp price movements increase. The VIX has been known to spike during periods of economic uncertainty, geopolitical tensions, and natural disasters.
Decoding the VIX: A Practical Guide
Harnessing the insights of the VIX requires a discerning eye. Here are a few tips to guide your interpretation:
- Gauge Market Sentiment: The VIX serves as a window into the collective psyche of the market. A high VIX indicates widespread fear and uncertainty, while a low VIX suggests a state of tranquility.
- Identify Potential Volatility: The VIX can serve as an early warning system for periods of potential market turbulence. Spikes in the VIX may foretell an impending correction or even a bear market.
- Manage Risk: Traders and investors can use the VIX to adjust their risk management strategies. When the VIX is elevated, it may be prudent to reduce exposure to riskier assets or hedge against potential losses.
- Trend Analysis: Monitoring the trend of the VIX over time can provide insights into the market’s direction. A rising VIX suggests increasing fear and volatility, while a declining VIX may signal a recovery in market sentiment.
- Historical Perspective: Keep in mind that the VIX is a forward-looking measure, but it can also be helpful to analyze its historical values. Past periods of high or low VIX may shed light on market behavior during similar conditions.

Image: www.tradingview.com
Navigating the Market with the VIX
While the VIX is a valuable tool, it should not be used in isolation. Consider these additional tips for a well-rounded approach to investing:
- Stay Informed: Keep abreast of current events, economic data, and other factors that can influence market volatility.
- Diversify Your Portfolio: Allocate your investments across different asset classes and sectors to reduce concentration risk.
- Control Your Emotions: Avoid making impulsive decisions based on temporary market fluctuations. Stick to your long-term investment plan.
- Consider Risk Levels: Assess your personal risk tolerance and invest accordingly. Don’t overextend yourself in pursuit of higher returns.
- Seek Professional Advice: If you’re unsure or need guidance, consult with a qualified financial advisor who can provide personalized advice.
Frequently Asked Questions About the VIX
Q: What is the normal range of the VIX?
A: The typical range for the VIX is between 10 and 20. Values below 10 indicate low volatility, while values above 20 suggest elevated volatility.
Q: How can I track the VIX?
A: The VIX is widely reported by financial news outlets and websites. You can also view its real-time value on the CBOE website.
Q: Can I trade the VIX directly?
A: Yes, there are various financial instruments that allow you to trade the VIX, such as VIX futures and VIX options.
What Is A Volatility Index
Conclusion
The Volatility Index (VIX) is a fascinating financial metric that provides a unique window into the market’s collective psyche. By understanding the VIX, investors can gain a deeper sense of market sentiment and volatility, empowering them to navigate the financial markets with greater confidence.
Remember, the VIX is just one tool among many in the arsenal of a successful investor. Use it judiciously, in conjunction with other market indicators and sound financial principles, to maximize your investment potential. Stay engaged, stay informed, and let the VIX be your guide as you traverse the unpredictable waters of the financial markets.
Is the topic of the Volatility Index intriguing to you? Share your thoughts and experiences in the comments section below.


