
Introduction
Fibonacci retracement is a powerful technical analysis tool that traders use to identify potential areas of support and resistance in a financial market. This technique, based on the mathematical sequence discovered by the Italian mathematician Leonardo Fibonacci centuries ago, has gained immense popularity among traders for its accuracy and effectiveness in predicting price movements. In this comprehensive guide, we will delve into the intricacies of Fibonacci retracement, exploring its history, nuances, and practical applications in the real world.
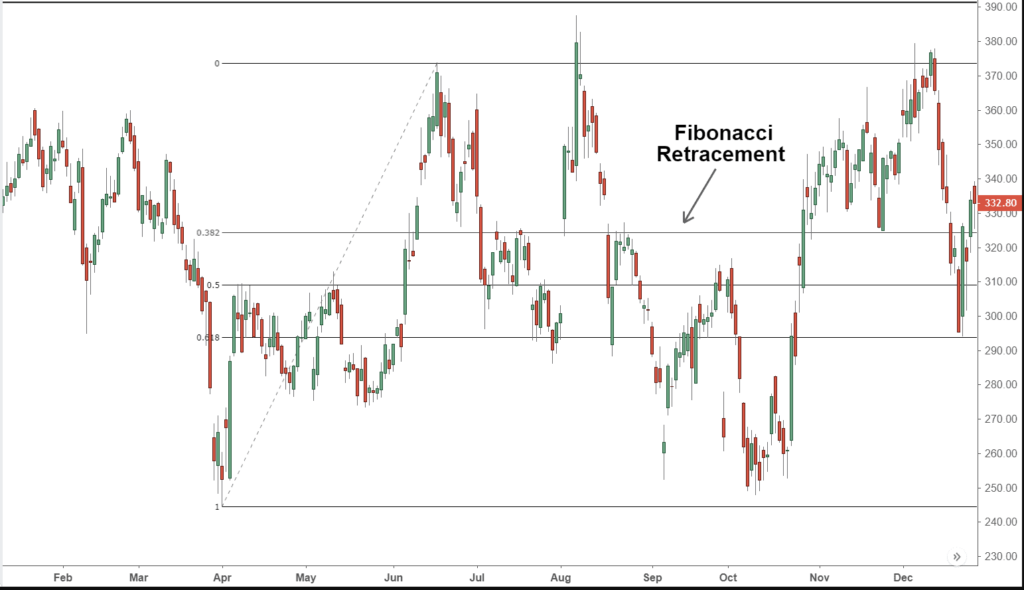
Image: forexarena.net
Fibonacci retracement owes its roots to the Fibonacci sequence, a series of numbers where each number is the sum of the two preceding ones (e.g., 0, 1, 1, 2, 3, 5, 8, 13, 21, 34, …). This sequence exhibits a remarkable property where the ratio of consecutive numbers approaches the golden ratio (approximately 1.618) as the sequence progresses. This concept is believed to manifest in various natural phenomena and financial markets, making the Fibonacci sequence invaluable to the field of technical analysis.
Understanding Fibonacci Retracement Levels
Fibonacci retracement levels are horizontal lines drawn on a price chart connecting significant high and low points. These levels, expressed as percentages of the previous swing, serve as potential support or resistance areas. The primary retracement levels are:
- 23.6%
- 38.2%
- 50.0%
- 61.8%
- 78.6%
- 100.0%
The 38.2% and 61.8% levels are considered the most significant, with the former often denoting a bounce and the latter a potential reversal. Higher Fibonacci levels, such as 78.6% and 100%, often indicate strong support or resistance.
How to Apply Fibonacci Retracement
To apply Fibonacci retracement to a price chart, identify a significant swing high and swing low. Then, plot the Fibonacci retracement levels between these two points using a Fibonacci calculator or an online charting platform. The area where the current market price intersects a retracement level often represents a potential turning point.
For instance, after an uptrend, the market might retrace 38.2% of the previous upswing before bouncing back higher. Conversely, during a downtrend, the market retracing 61.8% could signal a potential reversal, leading to further decline.
Practical Trading with Fibonacci Retracement
Traders use Fibonacci retracement in conjunction with other technical indicators and chart patterns to make informed trading decisions. Some common trading strategies include:
- Pullback Trading: Buying at Fibonacci support levels during an uptrend or selling at resistance levels during a downtrend.
- Breakout Trading: Waiting for a price breakout above a key Fibonacci level with increased volume to confirm a bullish trend, or below a level for a bearish trend.
- Target Setting: Using Fibonacci levels to determine potential profit targets when a trade has moved in the trader’s favor.

Image: www.victoriana.com
Real-World Examples of Fibonacci Retracement
Numerous examples showcase the effectiveness of Fibonacci retracement in real-world financial markets. Consider the price chart of Apple (AAPL) in 2023. After a strong uptrend from $140 to $170, the market retraced 38.2% to $160 before continuing its ascent.
Another example is the Euro/U.S. Dollar (EUR/USD) currency pair in 2021. After a downtrend from $1.25 to $1.19, the market retraced 61.8% to $1.22 before reversing and trending higher.
Limitations and Cautions
While Fibonacci retracement can be an invaluable tool, it is essential to understand its limitations:
- Not Predictive: Fibonacci retracement is not a forecasting tool and cannot predict future market movements.
- Subjectivity: The determination of swing high and swing low can be subjective and vary from trader to trader.
- Overreliance: Relying solely on Fibonacci levels without considering other factors can lead to missed opportunities or poor trading outcomes.
How To Use Fibonacci Retracement
Conclusion
Fibonacci retracement is a valuable technical analysis technique that provides traders with potential support and resistance levels in the market. By understanding the Fibonacci sequence and its application in price charts, traders can enhance their trading strategies, make informed decisions, and improve their chances of success. While not a perfect predictive tool, when used in conjunction with other analysis methods, Fibonacci retracement can be a powerful tool for any trader looking to navigate financial markets more effectively.


