
In the labyrinthine world of financial trading, where patterns and trends intertwine like an intricate tapestry, Fibonacci trading stands as a time-tested technique that seeks to harness the hidden rhythms of the market. Ever since its inception centuries ago, traders have relied on Fibonacci trading to navigate the ever-changing landscape of price movements, deciphering the cyclical nature of markets to gain an edge over their rivals.
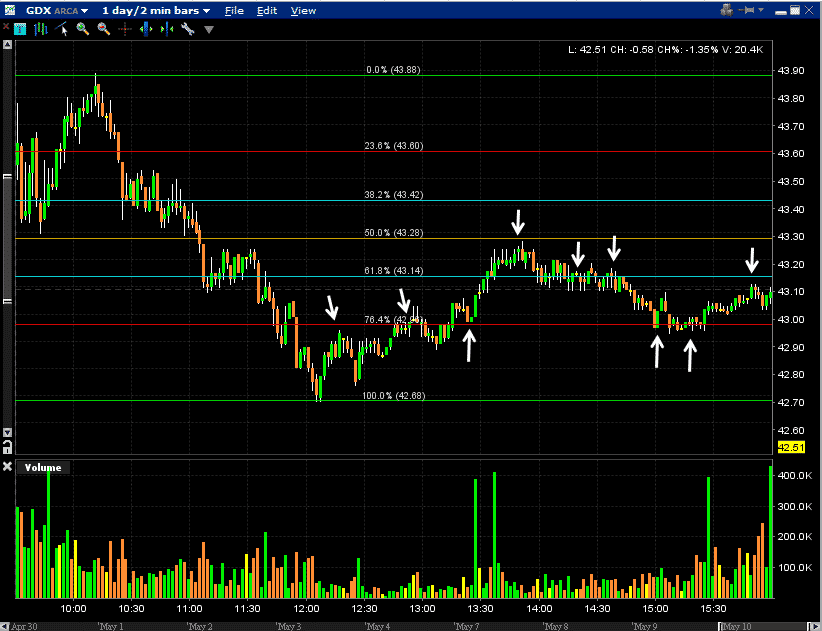
Image: www.optionstradingiq.com
What is Fibonacci Trading?
Fibonacci trading finds its roots in the renowned Fibonacci sequence, a series of numbers where each number (except the first two) is the sum of the two preceding ones. This seemingly simple numerical pattern, discovered by the Italian mathematician Leonardo Fibonacci, holds a surprising connection to the financial markets. Traders have observed that price movements in various assets often mimic the Fibonacci sequence, creating specific support and resistance levels that can guide trading decisions.
Fibonacci Ratios and the Golden Number
The Fibonacci sequence is not just a random series of numbers; it possesses specific ratios that have captivated minds for centuries. The most prominent ratio is 0.618, also known as the Golden Ratio or Golden Section. This ratio is found in numerous natural phenomena, from the proportions of human faces to the spirals of galaxies. In Fibonacci trading, the Golden Ratio is used to identify potential reversal points and profit targets.
Fibonacci Retracement Levels
One of the primary applications of Fibonacci trading is determining retracement levels. These levels represent the potential points where a market will pause or reverse after a significant move. By applying Fibonacci ratios to the swing high and low of a price movement, traders can identify these retracement levels (e.g., 23.6%, 38.2%, 50%, and 61.8%). These levels serve as potential buying or selling opportunities, depending on the market’s direction.

Image: pocketoption.trading
Fibonacci Expansion Levels
Fibonacci expansion levels extend the Fibonacci sequence beyond retracement levels to identify potential price targets. These levels are calculated by extending the Golden Ratio from the swing high or low of a price movement. Fibonacci expansion levels (e.g., 1.618, 2.618, and 4.236) can guide traders in setting profit targets and identifying potential price extensions.
Using Fibonacci Trading in Practice
While Fibonacci trading provides valuable insights, it’s essential to approach it with realism and proper risk management. It is not an exact science, and market movements can be unpredictable. However, by combining Fibonacci analysis with other technical indicators and a thorough understanding of market fundamentals, traders can enhance their decision-making process and improve their trading results.
Expert Insights on Fibonacci Trading
“Fibonacci trading is not a magic bullet, but it can be a powerful tool when used correctly,” says renowned trader John Bollinger. “By identifying Fibonacci levels and understanding their significance, traders can gain a deeper understanding of market structure and behavior.”
Another esteemed trader, Kathy Lien, adds, “Fibonacci trading is a time-tested technique that has stood the test of time. However, it’s important to remember that it’s one part of a comprehensive trading strategy. Combine it with other technical analysis tools and sound risk management practices for optimal results.”
What Is Fibonacci Trading
Conclusion
Fibonacci trading offers traders a unique approach to deciphering the rhythms of the market. By understanding Fibonacci ratios and applying them to price movements, traders can identify potential support and resistance levels, retracements, and profit targets. While not a foolproof technique, Fibonacci trading, when combined with other strategies and prudent risk management, can empower traders to make informed decisions and navigate the financial markets with greater confidence.


