
Identifying potential reversal points in an uptrend can be crucial for traders and investors looking to maximize their profits or minimize their losses. Fibonacci retracement levels provide a powerful technical analysis tool that can help identify these potential reversal points and assist in making informed trading decisions. In this comprehensive guide, we will delve into the intricacies of drawing Fibonacci retracement levels in an uptrend, exploring the underlying concepts, step-by-step guidance, and practical applications to empower you in your trading endeavors.

Image: br.pinterest.com
Understanding Fibonacci Retracement Levels
The Fibonacci sequence is a series of numbers where each number is the sum of the two preceding ones, beginning with 0 and 1. This sequence appears frequently in nature and has been applied to diverse fields, including financial markets. Fibonacci retracement levels are derived from this sequence and represent potential support and resistance levels within a trend. They are calculated by taking the ratio of two consecutive Fibonacci numbers and expressing it as a percentage. The most common retracement levels used in technical analysis are 23.6%, 38.2%, 50%, 61.8%, and 78.6%.
Drawing Fibonacci Retracement Levels in an Uptrend
-
Identify the Swing High and Swing Low: The first step involves identifying the most recent swing high (highest point) and swing low (lowest point) in the uptrend. These points define the range of the trend and serve as the basis for calculating the retracement levels.
-
Calculate the Fibonacci Levels: Determine the swing high value (H) and swing low value (L) of the uptrend. Then, calculate the Fibonacci retracement levels using the following formula:
- 23.6% Retracement = L + (H – L) * 0.236
- 38.2% Retracement = L + (H – L) * 0.382
- 50% Retracement = L + (H – L) * 0.5
- 61.8% Retracement = L + (H – L) * 0.618
- 78.6% Retracement = L + (H – L) * 0.786
-
Draw the Fibonacci Levels on the Chart: Once the Fibonacci levels are calculated, draw horizontal lines on the chart corresponding to each retracement level. These lines represent potential support and resistance zones within the uptrend.
Interpreting Fibonacci Retracement Levels
After drawing the Fibonacci retracement levels, traders can interpret them in various ways:
-
Potential Reversal Points: Fibonacci retracement levels can act as potential reversal points within an uptrend. If the price approaches a retracement level and fails to break through it, traders may anticipate a potential reversal or consolidation in the trend.
-
Price Targets: Fibonacci retracement levels can also serve as price targets for traders. If the price breaks through a retracement level, it can indicate a continuation or acceleration of the trend, with the subsequent retracement level acting as a potential target.
-
Risk Management: Fibonacci retracement levels can help traders manage their risk by setting stop-loss orders or taking profits at strategic retracement levels.
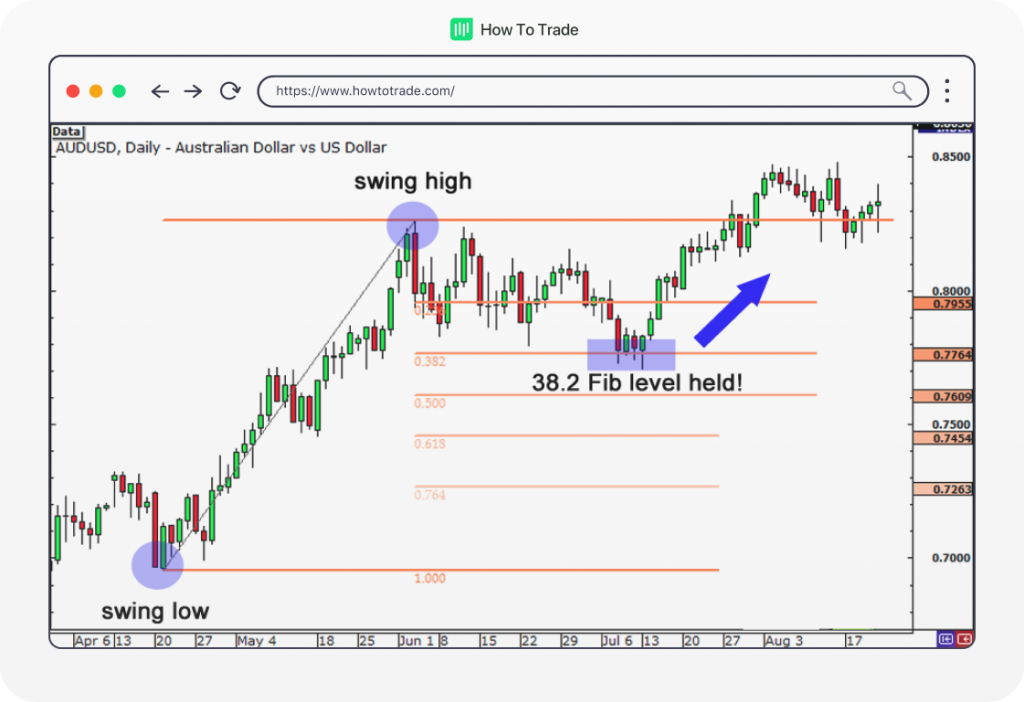
Image: howtotrade.com
How To Draw Fibonacci Retracement In Uptrend
Practical Applications of Fibonacci Retracement Levels
Fibonacci retracement levels find practical applications in trading, including:
-
Trend Trading: Identifying retracement levels can help traders determine potential points to enter or exit a trade in alignment with the overall trend.
-
Reversal Trading: Traders can anticipate potential reversals by observing the price action near significant retracement levels.
-
Risk Management: Fibonacci retracement levels provide support or resistance levels that can serve as guidelines for setting stop-loss orders and managing risk.
-
Trading Multiple Time Frames: Fib


