
Image: www.pinterest.fr
Introduction
In the ever-evolving realm of forex trading, deciphering market sentiment holds paramount importance. Enter candlestick charts, a cornerstone of technical analysis, designed to provide traders with invaluable insights into price dynamics and market psychology. For discerning traders eager to navigate the forex markets with confidence, mastering the art of reading candlestick charts is a non-negotiable skill. Thiscomprehensive guide will illuminate the nuances of candlestick charts, empowering you to unravel the emotions driving the markets.
Delving into Candlestick Charts: A Timeless Tool
Candlesticks originated from rice traders in 18th century Japan. These traders, keen on tracking the fluctuations of rice prices, developed a novel way to visualize price movements. Over time, candlestick charting gained traction among forex traders, cementing its status as an indispensable tool for discerning market behavior.
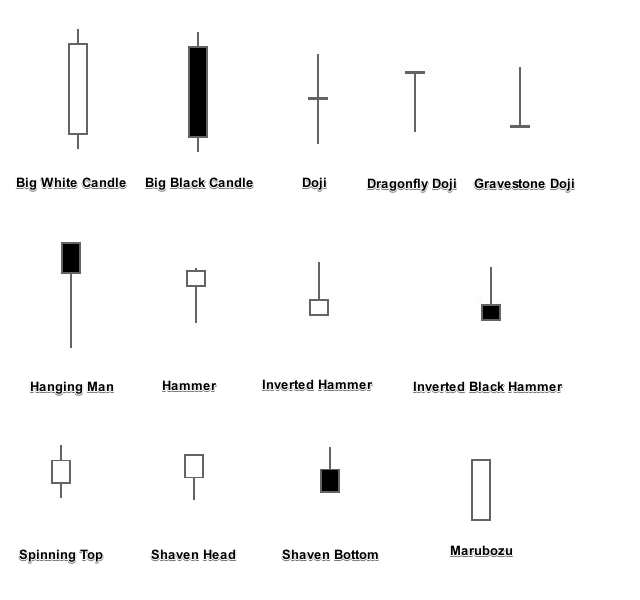
Each candlestick on the chart represents a specific time period, typically ranging from 5 minutes to 1 day. The body of the candle, delineated by the open and close prices, indicates whether the price moved higher or lower during the timeframe. The wicks, extending above and below the body, depict the highest and lowest prices reached within the period.
Deciphering Market Sentiment through Candlestick Patterns
Candlestick patterns, combinations of individual candlesticks, offer a visual representation of market sentiment. Traders rely on these patterns to identify potential trading opportunities, predict future price movements, and pinpoint areas of support and resistance.
A bullish engulfing candlestick pattern, for instance, signals a strong buying pressure. It encapsulates a bearish candle followed by a large bullish candle that engulfs the previous candle’s body, revealing the market’s shift towards a bullish sentiment. Conversely, a bearish engulging candlestick pattern, with a large bearish candle engulving the previous bullish candle, indicates a significant reversal to the downside.
Identifying Trend Reversals with Candlestick Formations
In addition to discerning market sentiment, candlestick patterns also function as harbingers of potential trend reversals. A double top or bottom candlestick formation, for example, arises when the price reaches a peak or a bottom twice. When this pattern emerges at the end of an uptrend, it suggests a potential reversal to the downside. Similarly, a triple bottom or top candlestick formation signifies a potential trend reversal at the end of a downtrend.
Expert Insights: Trading with Candlestick Charts
“Candlestick charts are a powerful tool for forex traders,” says seasoned trader John Carter. “By understanding candlestick patterns and their significance, traders gain valuable insights into market psychology, enabling them to make calculated and informed trading decisions.”
“Traders must remember,” cautions trader Kathy Lien, “that candlestick patterns are not foolproof indicators. They should always be used in conjunction with other technical analysis tools, such as moving averages and support and resistance levels, for a more comprehensive market understanding.”
Conclusion
Unlocking the secrets of forex candlestick charts is akin to unlocking the gateway to informed and profitable trading. By mastering the art of reading candlestick patterns, you gain the power to decipher market sentiment, identify trend reversals, and optimize your trading strategy. Remember, the path to success in forex trading lies in not only understanding the mechanics but also in grasping the emotions that shape the market’s ebb and flow. May this comprehensive guide serve as your compass, guiding you towards making astute trading decisions and achieving your financial goals.

Image: lamer.poolhome.es
How To Read Forex Candlestick Charts
https://youtube.com/watch?v=OEeCk0vgGx0


