
Introduction
In the realm of forex trading, candlestick patterns serve as an invaluable tool for traders seeking to decipher market movements and identify potential trading opportunities. These patterns, formed by the interplay of price action over specific periods, offer insights into market momentum, support and resistance levels, and the overall sentiment of participants.
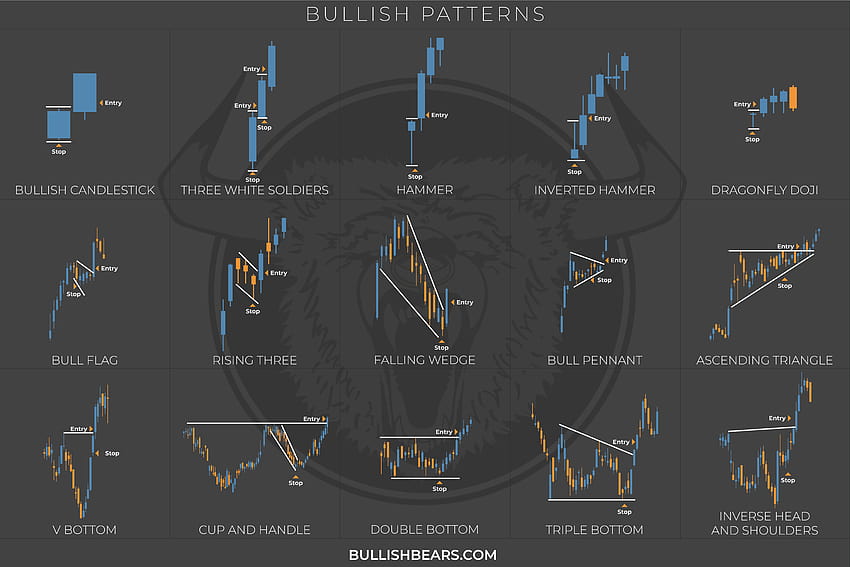
Image: www.pxfuel.com
A Journey into Candlestick Patterns
Candlesticks, originating from Japanese rice traders in the 18th century, depict a snapshot of price action over a defined timeframe. Each candlestick consists of a body (the thick portion) and two wicks (the thin lines extending above and below the body). The shape, color, and position of these components provide a wealth of information about market conditions.
Understanding Common Candlestick Patterns
A plethora of candlestick patterns exist, each with its unique characteristics. Some of the most commonly encountered include:
-
Bullish Patterns:
- Hammer: A single candlestick with a small body and a long lower wick, indicating buying pressure despite a downtrend.
- Engulfing Pattern: A two-candlestick pattern where the second candle completely engulfs the first, suggesting a strong reversal.
- Morning Star: A three-candlestick pattern that resemble a shooting star, signaling a potential uptrend.
-
Bearish Patterns:
- Hanging Man: Similar to the hammer, but with a long upper wick and a small body, indicating selling pressure despite an uptrend.
- Bearish Engulfing Pattern: A two-candlestick pattern where the second candle completely engulfs the first, implying a strong downtrend.
- Evening Star: A three-candlestick pattern that resembles an evening star, signaling a potential downtrend.
Identifying Trading Opportunities with Candlestick Patterns
Candlestick patterns alone should not be the sole basis for trading decisions. However, when combined with other technical indicators such as moving averages and support/resistance levels, they can provide valuable insights.
-
Confirming Trend Changes: Candlestick patterns can help identify potential trend changes or reversals. For instance, a bullish engulfing pattern occurring at a support level may indicate a potential uptrend.
-
Identifying Reversals: Candlestick patterns can also signal potential price reversals. A hanging man appearing at a resistance level may suggest a potential downtrend.
-
Measuring Market Momentum: The length and direction of candlestick wicks can provide insights into market momentum. Long wicks indicate strong buying or selling pressure.
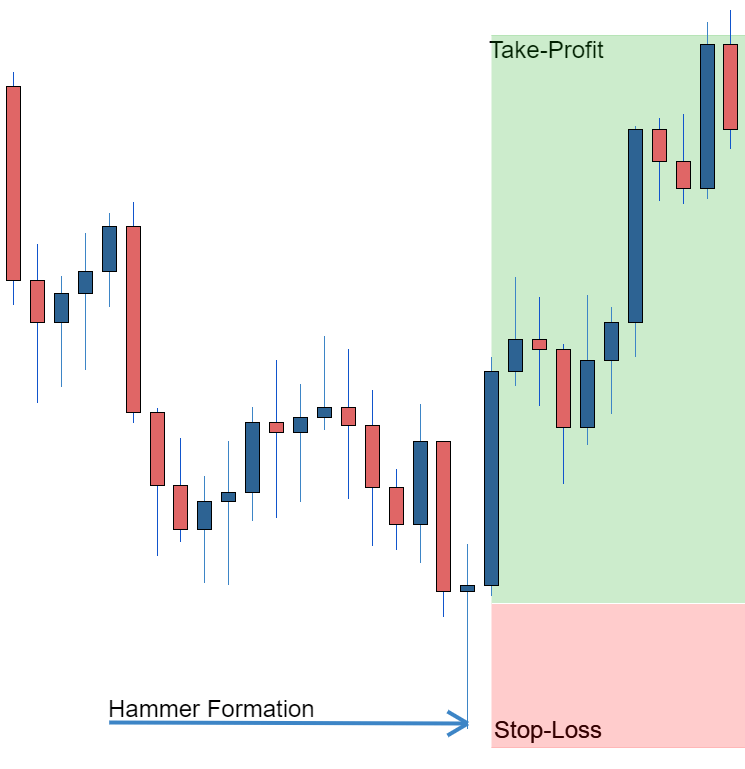
Image: sangbaddiganta.com
Empowering Traders: Expert Insights and Actionable Tips
Expert Insight: According to Steve Nison, a renowned candle charting expert, “Candlestick patterns are a time-tested tool that can provide valuable insights into market behavior.”
Actionable Tip: Use candlestick patterns in conjunction with other technical indicators to enhance the accuracy of trading signals.
Cautionary Note: While candlestick patterns offer valuable information, they should not be used in isolation. Always consider the overall market context and consult multiple sources before making trading decisions.
Candlestick Patterns For Forex
Conclusion
Candlestick patterns for forex trading provide a powerful tool for identifying potential trading opportunities. By understanding the characteristics of common patterns and combining them with other technical indicators, traders can gain insights into market momentum, support and resistance levels, and overall sentiment. However, it is crucial to use candlestick patterns judiciously and seek guidance from credible sources to enhance trading outcomes.


