
In the world of financial trading, candlesticks serve as illuminating beacons, guiding traders through the labyrinth of market movements like celestial bodies amidst the boundless night sky. Their flickering wicks and diverse patterns have captivated traders for centuries, empowering them to decipher market sentiment and predict future price fluctuations with remarkable precision.
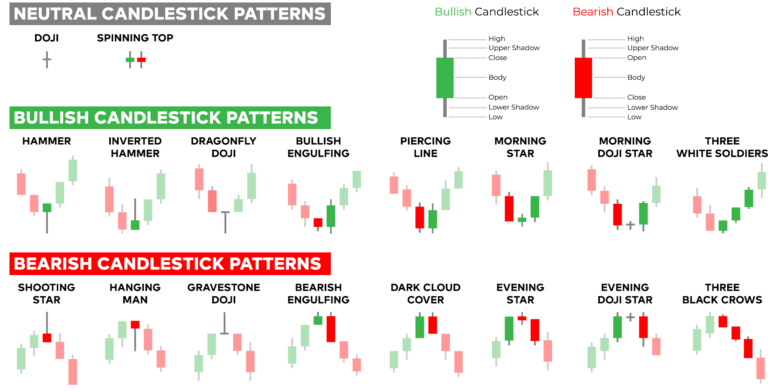
Image: www.andrewstradingchannel.com
Embark with us on an enlightening odyssey into the captivating world of candlestick trading, where we delve into the history, fundamentals, and diverse candle types that illuminate the intricate tapestry of price action. By mastering the art of candlestick interpretation, you’ll unlock a treasure trove of insights to empower your trading strategies and navigate market volatility with unwavering confidence.
Japanese Origins and Modern Genesis
Candlesticks first emerged in the 18th century in the bustling metropolis of Osaka, Japan. Honed by legendary rice traders like Munehisa Homma, these graphical representations evolved into a powerful tool for predicting rice price movements. Homma’s remarkable accuracy in forecasting market fluctuations earned him the revered title of the “God of Candlesticks.”
Over time, candlestick trading spread far beyond Japan’s shores, captivating the attention of Western traders and financial analysts alike. Today, candlesticks have become an indispensable component of technical analysis, enriching the repertoire of traders worldwide.
A Paradigm Shift: Reading Price Action with Candlesticks
Candlesticks depart from the traditional approach of relying solely on closing prices to narrate market dynamics. Instead, each candlestick encompasses a comprehensive account of four crucial price points:
-
Open: Depicts the price at which the asset opens for trading during a specific period (e.g., 1 hour, 4 hours, or daily)
-
Close: The price at which the asset closes for trading at the end of the period
-
High: Records the highest price the asset attains during the same period
-
Low: Marks the lowest point the asset sinks to during the same period
This comprehensive price panorama allows traders to discern the interplay between bulls (buyers) and bears (sellers) throughout the trading session. The resulting patterns, whether bullish or bearish, serve as valuable clues to gauging market sentiment and anticipating future price trajectories.
Unveiling the Lexicon of Candlesticks
The world of candlestick trading brims with a rich vocabulary, each term encapsulating a distinct market narrative:
-
Bullish Candles: Signal a market uptrend, characterized by higher closing prices than opening prices. The most prevalent bullish candle patterns include:
-
Doji: A cross-shaped pattern resembling an equal sign, indicating indecision in the market.
-
Hammer: A candlestick with a small body and a long lower wick, indicating potential bullish reversal.
-
Engulfing Bullish: A large bullish candlestick engulfing the entire range of the preceding bearish candlestick, signaling strong buying pressure.
-
Piercing Line Bullish: A considerable bullish candlestick breaking above the midpoint of the preceding bearish candlestick, marking a significant rally.
-
Bearish Candles: Portend a market downtrend, featuring lower closing prices than opening prices. Common bearish candle patterns encompass:
-
Shooting Star: A candlestick with a small body and long upper wick, insinuating possible bearish reversal.
-
Hanging Man: A bearish candlestick mirrored to the hammer, suggesting impending bearishness.
-
Engulfing Bearish: A large bearish candle engulfing the entire range of the preceding bullish candlestick, signaling strong selling pressure.
-
Dark Cloud Cover: A bearish candlestick forming after a significant rally, with its opening price gapping above the previous candlestick’s close and closing price penetrating the previous candlestick’s midpoint.

Image: www.sexizpix.com
Harnessing the Power of Candle Combinations
Beyond individual candlestick patterns, traders can extract even more potent insights by pairing diverse patterns together. These combinations, often referred to as candlestick formations, paint a comprehensive picture of market momentum and sentiment. Some commonly used candlestick formations are:
-
Bullish Harami: A small bullish candlestick engulfed within a preceding larger bearish candlestick.
-
Bearish Harami: A small bearish candlestick engulfed within a preceding larger bullish candlestick.
-
Morning Star: A pair of bullish candlesticks occurring after a downtrend, consisting of a long bearish candlestick, followed by a small bullish candlestick, and then a large bullish candlestick.
-
Evening Star: A pair of bearish candlesticks occurring after an uptrend, comprising a long bullish candlestick, followed by a small bearish candlestick, and finally a large bearish candlestick.
Unveiling Expert Insights and Actionable Strategies
To elevate your candlestick trading prowess, gleaning wisdom from seasoned experts is paramount. Here are two invaluable insights:
-
Market Context is King: While candlestick patterns provide valuable information, adept traders are meticulous in evaluating them within the broader market context. Consider incorporating fundamental analysis, economic indicators, and industry trends to form a multifaceted market narrative.
-
Patience is a Virtue: Mastering candlestick trading requires patience and discipline. Resist the allure of impulsive trading decisions based on isolated signals. Allow price action to unfold and develop distinct patterns to increase your trading accuracy.
Types Of Candles Trading
https://youtube.com/watch?v=nMHjRrm4Yt4
Igniting Your Trading Journey with Candlesticks
To ignite your trading journey with candlesticks, embrace the following actionable tips:
-
Familiarity Breeds Confidence: Dedicate time to studying different candlestick patterns. Immerse yourself in their nuanced variations and intricacies until they become ingrained in your trading lexicon.
-
Practice Makes Perfect: Apply your newfound knowledge by practicing with historical data or a trading simulator. Observe price action and identify candlestick patterns in real-time to enhance your pattern recognition skills.
-
Seek Validation: Never rely solely on a single candlestick pattern for trading decisions. Seek confluence from multiple indicators and patterns to bolster your trading confidence.
-
Manage Risks Prudently: Deploy sound risk management strategies like stop-loss orders to mitigate potential losses. Remember, successful trading is not about eliminating risk but managing it effectively.
As you navigate the labyrinthine paths of financial markets, may the flickering wicks of candlesticks illuminate your path toward trading success. Embrace the knowledge and strategies outlined in this comprehensive guide, and may your trades burn brightly with profits.


