
In the realm of financial trading, traders and investors seek strategies to navigate market fluctuations and uncover potential trading opportunities. One such tool that has gained widespread recognition is the Fibonacci retracement. This technique, based on the mathematical discoveries of Leonardo Fibonacci, provides valuable insights into market behavior and helps identify potential areas of support and resistance. Understanding and applying Fibonacci retracements can empower traders with a powerful decision-making tool.

Image: fdgtacademy.com
What are Fibonacci Retracements?
Fibonacci retracements are a technical analysis tool that utilizes horizontal lines to mark out potential areas of support and resistance in a financial instrument’s price movement. These lines are calculated based on predetermined Fibonacci ratios, which are derived from the Fibonacci sequence, a series of numbers where each subsequent number is the sum of the two preceding ones. The most commonly used Fibonacci ratios in retracement analysis are 23.6%, 38.2%, 50%, 61.8%, and 100%. The Fibonacci retracement levels indicate the extent to which a price will retrace, or pull back, after a significant move up or down.
The Psychology Behind Fibonacci Retracements
The Fibonacci sequence and its application in finance stem from the concept that markets tend to move in predictable patterns. Traders believe that these patterns, often described as waves or trends, can be identified and measured using Fibonacci ratios. Fibonacci retracements function on the assumption that a pullback in price will likely occur at a Fibonacci level before the trend continues in its original direction.
Practical Applications of Fibonacci Retracements
Traders utilize Fibonacci retracements in various ways to identify potential trading opportunities. A retracement to a key Fibonacci level can signal a favorable entry or exit point. For instance, if a stock has made a significant uptrend, a retracement to the 38.2% or 61.8% Fibonacci level could present an opportunity to buy or enter a long position. Conversely, if the stock is in a downtrend, a retracement to a Fibonacci level might indicate a potential area to consider shorting or exiting a long position.
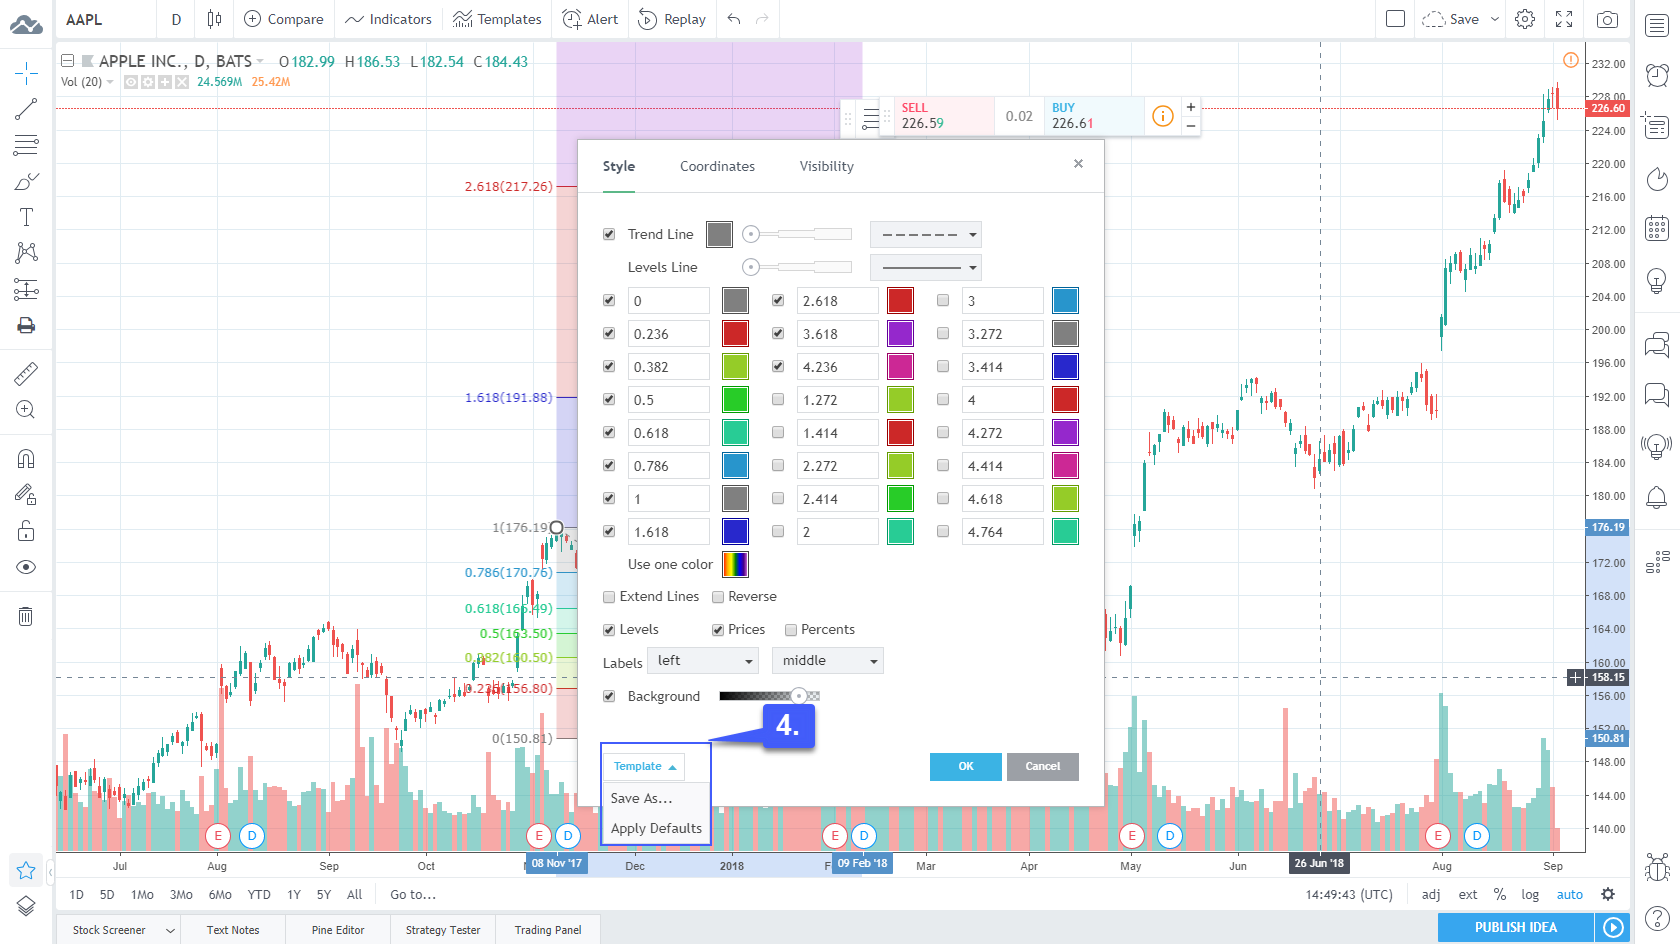
Image: community.optimusfutures.com
Limitations of Fibonacci Retracements
While Fibonacci retracements offer valuable insights, they are not foolproof indicators and have certain limitations. They are not a magic formula for predicting market movements and should be used in conjunction with other technical indicators and fundamental analysis. Additionally, market behavior is not always predictable, and Fibonacci retracements may not work in all cases.
What Is Fib Retracement
Conclusion
Fibonacci retracements are a versatile technical analysis tool that can help traders identify potential zones of support and resistance. Understanding and applying Fibonacci retracements can provide valuable insights into market behavior and assist traders in making informed trading decisions. While Fibonacci retracements should not be viewed as standalone investment recommendations, they can be a helpful tool in the trader’s arsenal when used in conjunction with other analysis methods.


