
Introduction
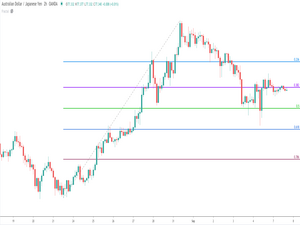
Image: forextraininggroup.com
In the realm of financial trading, precision and timing are paramount. Identifying the opportune moments to enter and exit trades is a daunting task, but technical analysis tools can provide invaluable insights. Enter the Fibonacci retracement, a charting technique that has captivated traders for decades. This article aims to delve into the essence of Fibonacci retracement, unraveling its historical roots and offering practical guidance on how to harness its predictive power in your trading endeavors.
Unveiling the Fibonacci Logic
The Fibonacci numbers, a sequence wherein each number is the sum of the two preceding ones, possess an uncanny affinity with the patterns observed in nature and financial markets. From swirling seashells to galaxy formations, the Fibonacci ratio manifests itself ubiquitously. This harmony extends to the ebb and flow of stock prices, making Fibonacci retracement an indispensable tool in discerning market trends.
Fibonacci retracement levels, typically depicted as horizontal lines on a price chart, denote the potential areas where a stock or currency might pause or reverse its course. These levels are derived from specific Fibonacci ratios, such as 23.6%, 38.2%, 50%, 61.8%, and 78.6%. They represent significant levels of resistance or support, indicating price zones where the trend may consolidate or reverse.
How to Plot Fibonacci Retracements
Plotting Fibonacci retracement levels on a price chart is a straightforward process. First, identify two significant price points: a recent swing high and a swing low. These points will serve as the starting and ending points of your retracement.
Next, insert a Fibonacci retracement indicator onto your chart. Most charting platforms offer this tool as an add-on. The indicator will automatically generate the Fibonacci levels based on the price range you specify.
Identifying Trading Opportunities with Fibonacci Retracements
Fibonacci retracement levels serve as valuable reference points for identifying potential trading opportunities. When a price movement retraces back to a Fibonacci level, it signals a possible reversal or retracement. Traders can capitalize on these signals by initiating long or short positions accordingly.
For example, a price trend that retraces to the 38.2% level could present an opportunity to buy, while a retracement to the 61.8% level could indicate a potential selling point. It is important to note that these levels are not absolute predictors, but rather probabilistic zones that increase the likelihood of price reversals.
Expert Insights and Actionable Tips
Seasoned traders have honed their expertise in utilizing Fibonacci retracement for successful trading. Here are some valuable insights from the masters:
-
Confirm with Other Indicators: Fibonacci retracement should not be used in isolation. Combining it with other technical analysis tools such as moving averages or support and resistance levels enhances the accuracy of your trading decisions.
-
Context is Key: Always consider the broader market context when interpreting Fibonacci retracements. A strong trend may pierce through Fibonacci levels, while a weak trend may respect them more closely.
-
Multiple Time Frames: Fibonacci retracement can be applied to different time frames, from intraday charts to weekly or monthly charts. Experiment with various time frames to identify areas of support and resistance that align across multiple periods.
Conclusion
Fibonacci retracement stands as a powerful technical analysis tool that empowers traders to discern market trends and predict potential price movements. By embracing its nuances and applying it diligently, investors can elevate their trading strategies and capitalize on the dynamic interplay of financial markets. Remember, the true mastery of Fibonacci retracement lies in combining it with a comprehensive understanding of market dynamics and rigorous risk management practices.

Image: www.marketvolume.com
How To Put Fibonacci Retracement In Chart


