
Unveiling the Secrets of Fibonacci Retracement
Imagine you’re on a rollercoaster ride, enjoying the upswing, but suddenly it dips down. How do you predict if it’s just a temporary setback or the start of a downward spiral? The Fibonacci retracement technique can help you navigate these financial roller coasters, giving you an edge in making informed trading decisions.
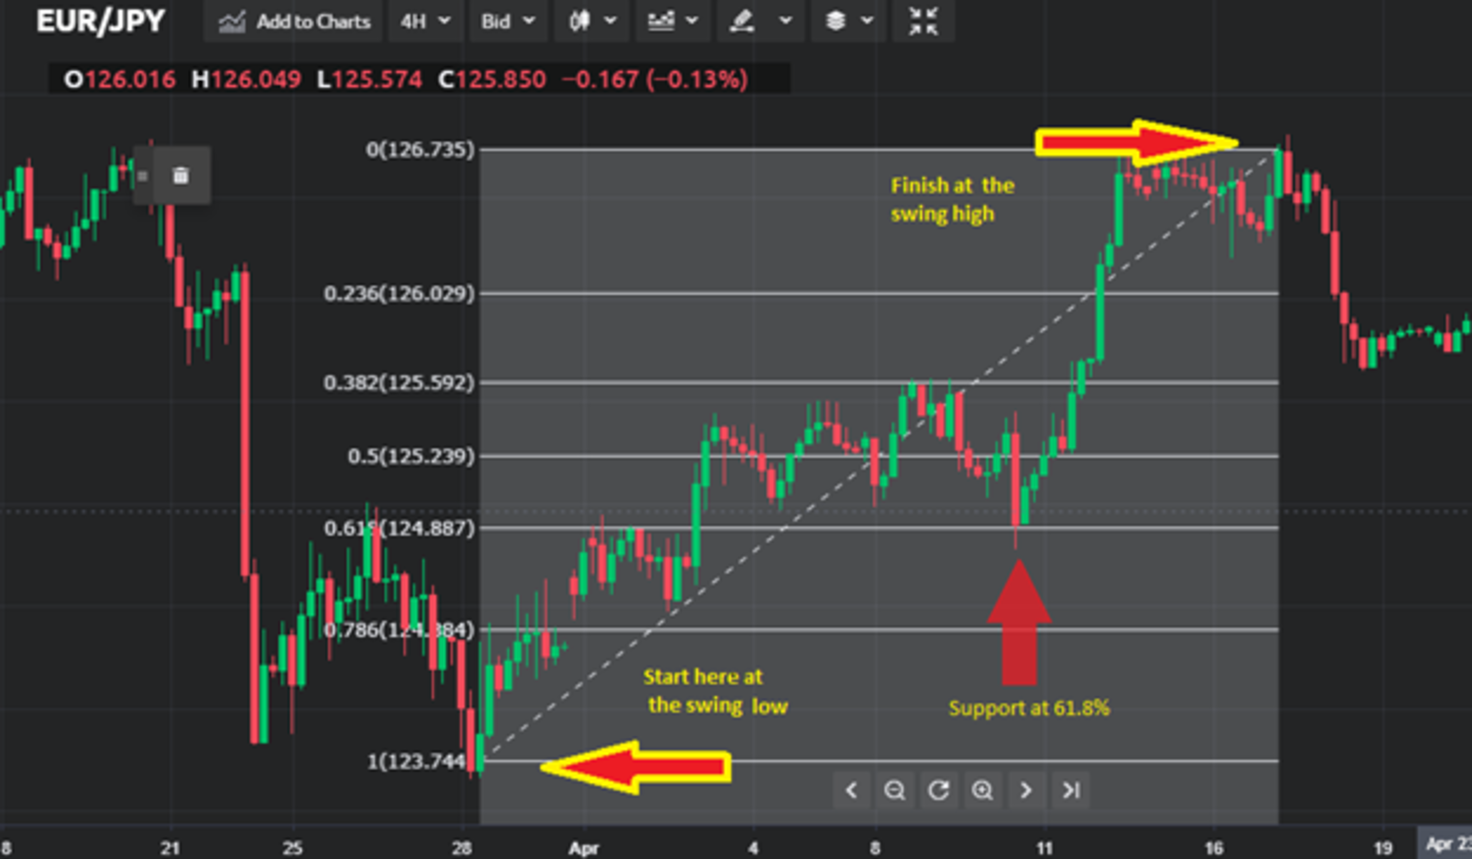
Image: dzengi.com
In this comprehensive guide, we’ll explore the intricate world of Fibonacci retracement, delving into its history, foundational principles, and real-world applications. Whether you’re a seasoned trader or just starting out, this elucidating article will empower you to decipher the mysteries of market retracements with confidence.
What is Fibonacci Retracement?
The Fibonacci retracement technique is a trading tool based on the mathematical concept of the Fibonacci sequence, a series of numbers where each number is the sum of the two preceding ones (0, 1, 1, 2, 3, 5, 8, 13, 21…). Developed by Italian mathematician Leonardo Fibonacci in the 13th century, this sequence has been remarkably effective in predicting price movements in financial markets.
When applied to price charts, Fibonacci retracement levels represent potential areas where a price trend may pause or reverse. These levels are calculated as percentages of the preceding trend’s size, with common retracement levels being 23.6%, 38.2%, 50%, and 61.8%. By identifying these levels, traders can anticipate possible support and resistance zones, guiding their trading strategies accordingly.
Fibonacci Retracement Levels
The Fibonacci sequence’s peculiar properties yield specific ratios that form the basis of Fibonacci retracement levels. These levels, expressed as percentages, have consistently demonstrated their significance in market analysis:
-
23.6% retracement level: This level represents the first potential area where a price trend might pause or reverse. It is calculated by finding 23.6% of the preceding trend’s size.
-
38.2% retracement level: A more significant retracement level, it marks a key area where the trend may encounter greater resistance or support. It is calculated by finding 38.2% of the preceding trend’s size.
-
50% retracement level: This level represents a midpoint in the preceding trend and often acts as a pivotal support or resistance level. It is calculated as 50% of the preceding trend’s size.
-
61.8% retracement level: This is considered a strong Fibonacci level, indicating a potential reversal point in the trend. It is calculated by finding 61.8% of the preceding trend’s size.
Applications of Fibonacci Retracement
Understanding Fibonacci retracement levels provides valuable insights for traders navigating complex markets:
-
Identify Support and Resistance Zones: Fibonacci levels can help traders identify areas where a price trend may encounter support or resistance. Price action near these levels often reflects a change in market sentiment, providing valuable trading cues.
-
Predict Price Targets: By combining Fibonacci retracement levels with other technical analysis techniques, traders can determine potential price targets for a given trend. This helps in setting realistic profit targets and managing risk.
-
Time Market Entries and Exits: Fibonacci retracement levels can be used to identify optimal entry and exit points for trades. When prices approach key Fibonacci levels, traders can anticipate potential price reversals and adjust their positions accordingly.
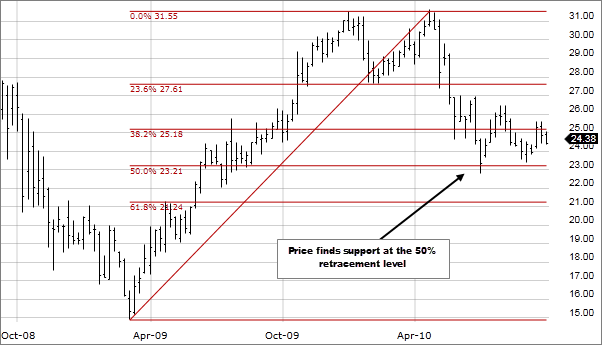
Image: www.fidelity.com
Expert Insights: Harnessing the Power of Fibonacci Retracement
Renowned trader Mark Douglas emphasizes the value of Fibonacci retracement: “Fibonacci retracements provide an objective, quantitative method for identifying support and resistance areas… They can help you spot potential turning points in the market.”
Expert market analyst John Murphy advises traders to use Fibonacci retracements in conjunction with other technical indicators: “Fibonacci retracement levels alone are not sufficient to make trading decisions… Combining them with trend analysis, volume analysis, and other technical tools improves their accuracy.”
Actionable Tips for Traders
-
Combine Fibonacci retracement with trend analysis: Confirm Fibonacci retracement levels with prevailing market trends for enhanced accuracy.
-
Consider multiple Fibonacci levels: Look for confirmation from several Fibonacci levels to increase the reliability of your analysis.
-
Use Fibonacci retracement as a risk management tool: Identify potential stop-loss and take-profit levels based on Fibonacci retracement zones to safeguard your trades.
How To Read Fibonacci Retracement
Conclusion: Mastering the Art of Fibonacci Retracement
Fibonacci retracement, rooted in ancient mathematical principles, remains a powerful tool for modern traders. By understanding its concepts, applying its techniques, and incorporating expert insights, you can elevate your trading strategies, maximize profit potential, and navigate market fluctuations with greater confidence. Remember, the journey of mastering Fibonacci retracement is ongoing, but the rewards it offers make it a worthwhile pursuit for any serious trader.


