
Introduction
Navigating the complex world of forex trading requires a thorough understanding of how to interpret trading charts. Forex charts visually represent the price fluctuations of currency pairs, providing invaluable insights into market trends and potential trading opportunities. This guide will delve into the intricacies of forex chart reading, empowering you with the knowledge to make informed trading decisions.
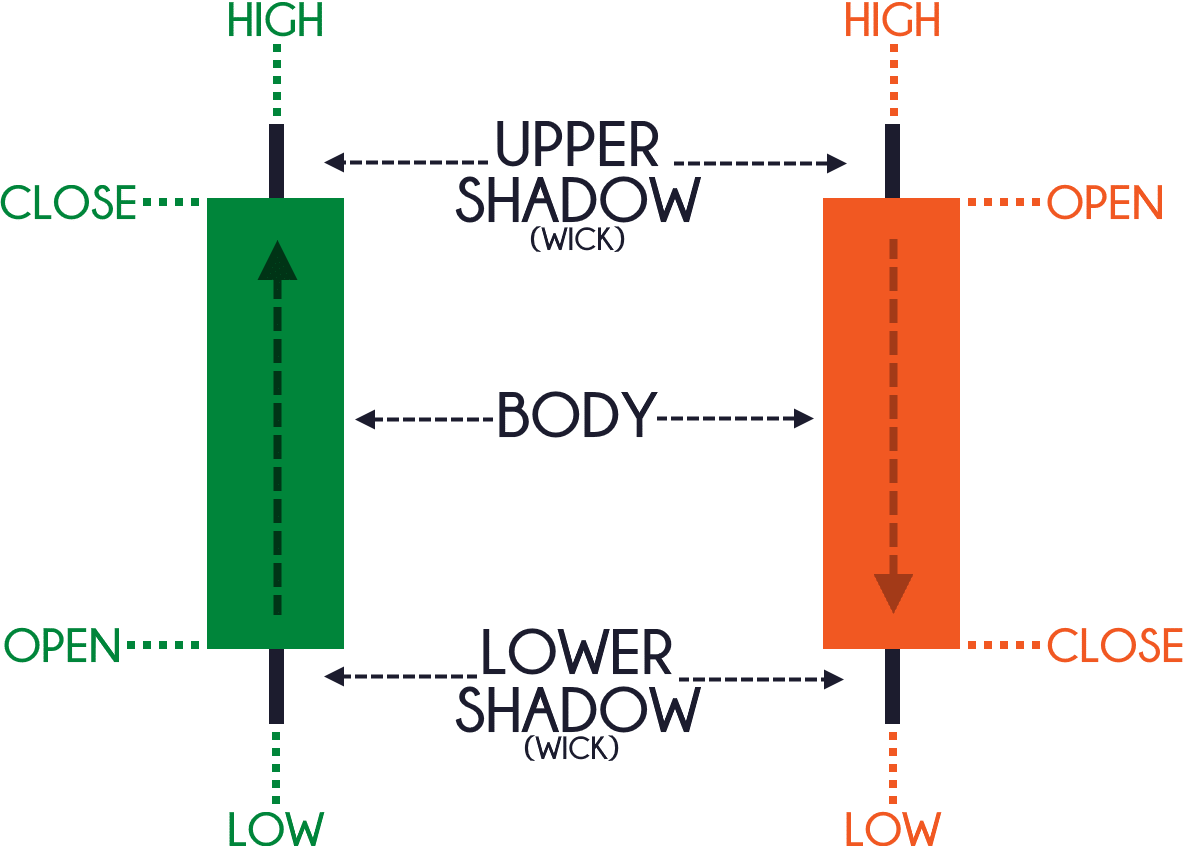
Image: cuahangbakingsoda.com
Forex charts track the real-time movement of currency pairs, displaying the exchange rate between them over a specified time frame. Understanding the different types of charts, indicators, and patterns on these charts is essential for successful trading.
Types of Forex Charts
There are three primary types of forex charts:
This chart connects the closing prices of a currency pair over time, creating a line that represents the overall price trend.
Bar charts display the open, high, low, and close prices of a currency pair within a specified time frame. The vertical line represents the range between the high and low prices, while the horizontal lines indicate the open and close prices.
Candlestick charts are similar to bar charts, but they provide more information. The body of the candlestick represents the range between the open and close prices, while the wicks (lines extending above and below the body) show the high and low prices. Candlestick patterns offer valuable insights into market sentiment and potential price reversals.
Technical Analysis
Technical analysis is the study of historical price data to identify patterns and trends that may help traders predict future price movements. Forex charts are extensively used in technical analysis, as they provide a visual representation of these patterns and trends.
Technical indicators are mathematical calculations that help identify trading opportunities. Some popular technical indicators include:
Moving averages smooth out price fluctuations, making it easier to spot trends. Traders use different types of moving averages, such as the simple moving average (SMA) and exponential moving average (EMA), to identify support and resistance levels.
Bollinger Bands are a volatility indicator that helps identify overbought or overbought conditions. The bands consist of an upper band, a lower band, and a moving average in the middle. When prices move outside the Bollinger Bands, it may indicate a potential reversal.
RSI measures the strength of a trend by comparing the magnitude of recent gains to recent losses. RSI values range from 0 to 100, with values above 70 indicating overbought conditions and values below 30 indicating oversold conditions.
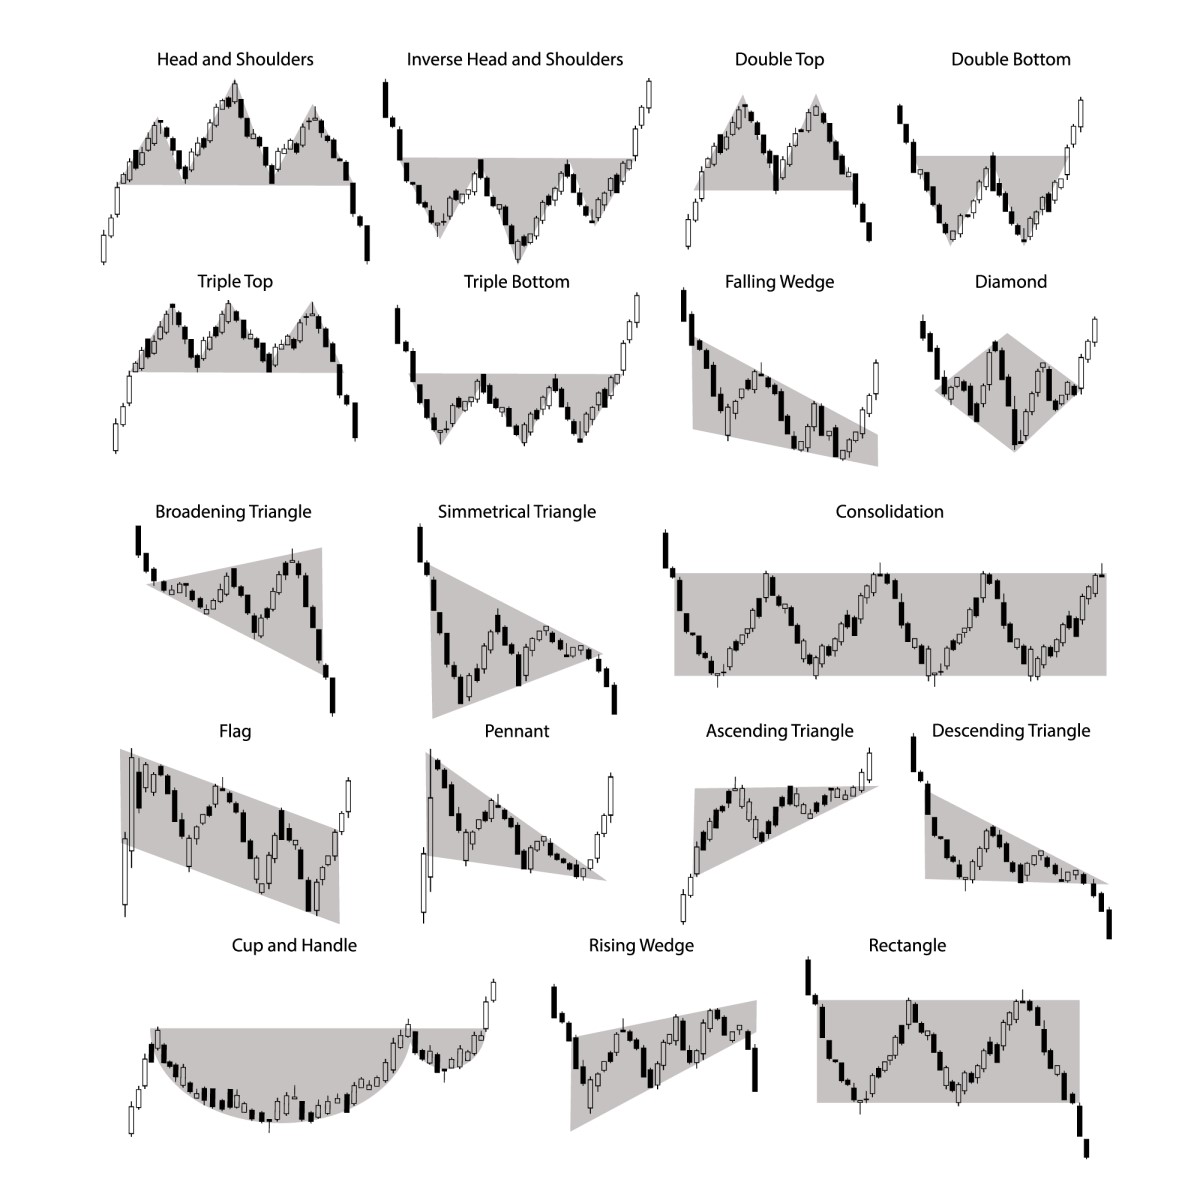
Image: www.forex-awards.com
Chart Patterns
Chart patterns are specific formations that occur on price charts and can provide insights into the potential direction of price movement. Some common chart patterns include:
These patterns indicate that a downtrend may be reversing or a new uptrend may be starting. Examples include double bottoms, inverse head and shoulders, triangle, and cup and handle.
These patterns indicate that an uptrend may be reversing or a new downtrend may be starting. Examples include double tops, head and shoulders, reverse triangle, and falling wedge.
These patterns indicate that the current trend is likely to continue. Examples include flags, pennants, triangles, and channels.
How To Read Forex Trading Charts
Conclusion
Reading forex trading charts requires a combination of knowledge, experience, and analytical skills. By understanding the different chart types, technical indicators, and patterns, you can effectively analyze market conditions and make informed trading decisions. Remember, chart analysis is not an exact science, and there is no guarantee of success. However, by mastering the art of chart reading, you will gain a significant advantage in the complex world of forex trading.


