
In the realm of technical analysis, Fibonacci retracement levels hold immense significance for traders and investors seeking to anticipate price movements in the financial markets. Derived from the Fibonacci sequence, a series of naturally occurring numbers, these levels provide valuable insights into potential support and resistance zones where prices may pause or reverse. Understanding how Fibonacci retracement levels are calculated is crucial for harnessing their predictive power.
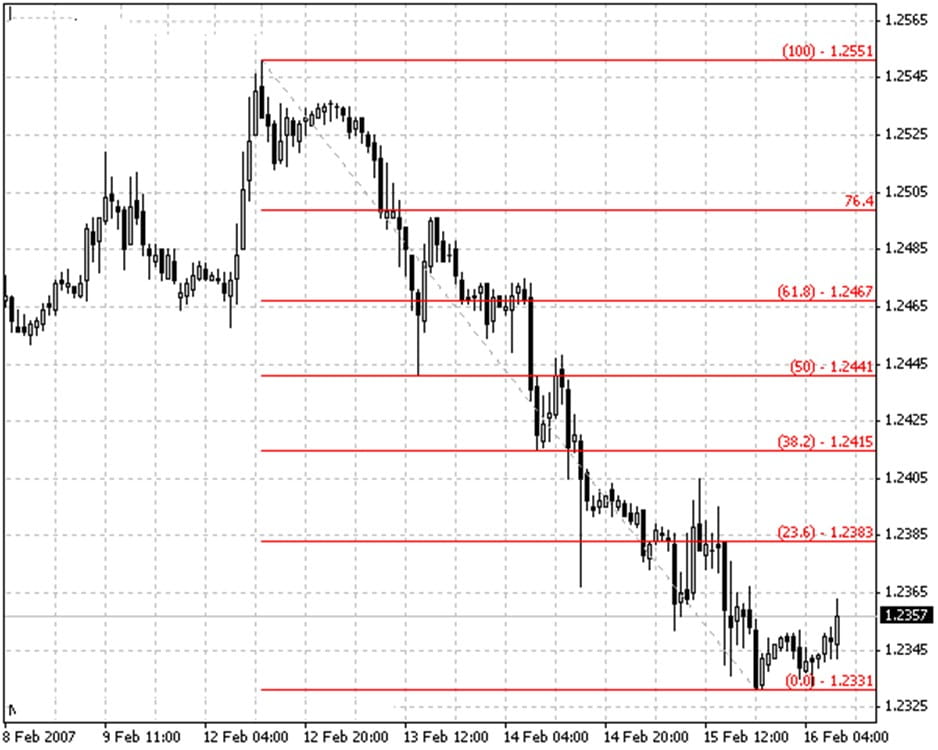
Image: libertex.org
A Journey into Mathematical Precision
The Fibonacci sequence, discovered by the Italian mathematician Leonardo Fibonacci in the 13th century, is a series of numbers where each number is the sum of the two preceding numbers. This mesmerizing sequence, starting with 0 and 1, progressively unfolds as 1, 1, 2, 3, 5, 8, 13, 21, and so on.
Fibonacci retracement levels are calculated by dividing two consecutive Fibonacci numbers and rounding the result to the nearest percentage. For instance, the ratio of 21 to 34, rounded to the nearest percentage, yields the key Fibonacci retracement levels of 23.6%, 38.2%, 50%, 61.8%, and 78.6%.
Applying Fibonacci Magic to Financial Analysis
Traders employ Fibonacci retracement levels on price charts to identify potential areas where prices might temporarily pause or reverse before resuming their predominant trend. These levels are particularly useful in highly volatile markets, where price swings can be unpredictable.
To apply Fibonacci retracement levels, traders first identify the swing high and swing low of a particular price movement. The swing high represents the highest price point in an uptrend, while the swing low denotes the lowest price point in a downtrend.
Once the swing high and swing low are determined, the Fibonacci retracement levels are plotted on the price chart. The 38.2%, 50%, and 61.8% levels are considered major retracement levels, while the 23.6% and 78.6% levels are minor retracement levels.
Deciphering Price Movements with Fibonacci’s Guidance
In an uptrend, retracement levels act as potential support zones. As prices retrace, or pull back, from a swing high, the Fibonacci retracement levels can indicate areas where buying pressure might emerge, causing a price rebound.
Conversely, in a downtrend, retracement levels serve as potential resistance zones. As prices pull back from a swing low, the Fibonacci retracement levels can suggest areas where selling pressure could intensify, leading to a price reversal.

Image: www.protradingschool.com
Expert Insights: Unlocking the Trading Edge
According to renowned trading expert Peter Crabtree, “Fibonacci retracement levels are an effective tool for identifying trading opportunities. They provide traders with a framework to anticipate support and resistance areas, enabling them to make informed decisions.”
Crabtree emphasizes that Fibonacci retracement levels are not perfect indicators and should be used in conjunction with other technical analysis tools, such as candlestick patterns and moving averages.
Actionable Tips: Empowering Precision Trading
-
Determine the swing high and swing low accurately to ensure precise Fibonacci retracement level calculations.
-
Track price movements relative to Fibonacci retracement levels to identify potential trading opportunities.
-
Use Fibonacci retracement levels as a complementary tool alongside other technical indicators for enhanced analysis.
-
Continuously monitor market conditions and adjust your trading strategy as needed, as Fibonacci retracement levels are dynamic and subject to change.
How Are Fibonacci Retracement Levels Calculated
Conclusion: Enhancing Trading Prowess
Fibonacci retracement levels, rooted in mathematical precision, provide traders with a powerful tool to anticipate price movements in the financial markets. By understanding how Fibonacci retracement levels are calculated and utilizing them effectively, traders can gain valuable insights into potential support and resistance zones, empowering them to make well-informed trading decisions. Embrace the Fibonacci magic and unlock the path to enhanced trading success.


