
Introduction
In the ever-evolving landscape of financial markets, traders seek innovative tools to navigate the complexities of price movements. One such tool that has gained significant traction is Fibonacci retracement. Derived from the eponymous mathematical sequence, Fibonacci retracement assists traders in identifying potential support and resistance levels, facilitating more informed trading decisions. Understanding how to use Fibonacci retracement effectively can unlock a wealth of opportunities and enhance your trading prowess.
Deciphering the Fibonacci Sequence
The Fibonacci sequence, championed by 13th-century Italian mathematician Leonardo Fibonacci, encapsulates a series of numbers where each subsequent number is the sum of the preceding two. The sequence commences with 0 and 1, progressing as follows: 0, 1, 1, 2, 3, 5, 8, 13, 21, and so on. As the sequence unfurls, the ratio between consecutive numbers converges towards the golden ratio or phi, approximately 1.618.
Fibonacci Retracement in Technical Analysis
Technical analysis is a method of forecasting price movements by studying historical data, particularly price patterns, volume, and other quantitative indicators. Fibonacci retracement is a popular technical analysis tool that leverages the Fibonacci sequence to pinpoint potential areas of support and resistance in financial markets. These levels are often viewed as retracement zones, where price might encounter temporary pause or reversal, before resuming its primary trend.
Implementing Fibonacci Retracement
To employ Fibonacci retracement, identify two significant price points, referred to as the swing high and swing low. The swing high denotes the highest price reached during an uptrend, while the swing low represents the nadir during a downtrend. Once the key points are established, calculate the Fibonacci retracement levels using the following ratios:
- 23.6% (0.236)
- 38.2% (0.382)
- 50% (0.5)
- 61.8% (0.618)
- 78.6% (0.786)
These ratios correspond to horizontal lines drawn from the swing high to the swing low, creating a series of retracement levels that delineate potential support or resistance zones.
:max_bytes(150000):strip_icc()/dotdash_Final_How_to_Draw_Fibonacci_Levels_Nov_2020-01-721becdc34264cceb240c7f755939d50.jpg)
Image: www.investopedia.com
Interpreting Retracement Levels
After plotting the Fibonacci retracement levels, traders can anticipate potential price movements based on the market’s interaction with these levels.
- Support Zones: Retracement levels at 23.6%, 38.2%, and 50% are seen as potential support levels during uptrends. If the price falls back to these levels during an uptrend, traders may anticipate a bounce or a temporary pause in the downtrend.
- Resistance Zones: Conversely, Fibonacci retracement levels at 50%, 61.8%, and 78.6% might indicate resistance levels in downtrends. Traders can expect the price to encounter resistance or a pause in the uptrend upon reaching these levels.
It is crucial to note that Fibonacci retracement levels are not foolproof indicators, and the market may not always respect these levels rigidly. However, they offer valuable insights into potential market behavior, enabling traders to make more informed trading decisions.
Practical Applications of Fibonacci Retracement
Fibonacci retracement plays a versatile role in various trading strategies.
- Identifying Trading Opportunities: Fibonacci retracement levels can help traders identify potential trading opportunities by signaling potential support or resistance levels. By anticipating price movements, traders can position themselves appropriately to enter or exit trades.
- Setting Stop-Loss and Take-Profit Levels: Fibonacci retracement levels can assist in determining appropriate stop-loss and take-profit levels. Traders can set stop-loss just below (in uptrends) or above (in downtrends) key retracement levels to limit risk. Conversely, take-profit levels can be set at potential resistance or support zones denoted by Fibonacci levels.
- Confirming Trends: Fibonacci retracement can aid in confirming existing market trends. If the price consistently bounces or pauses at a specific retracement level during a trend, it strengthens the notion that the trend is likely to continue.
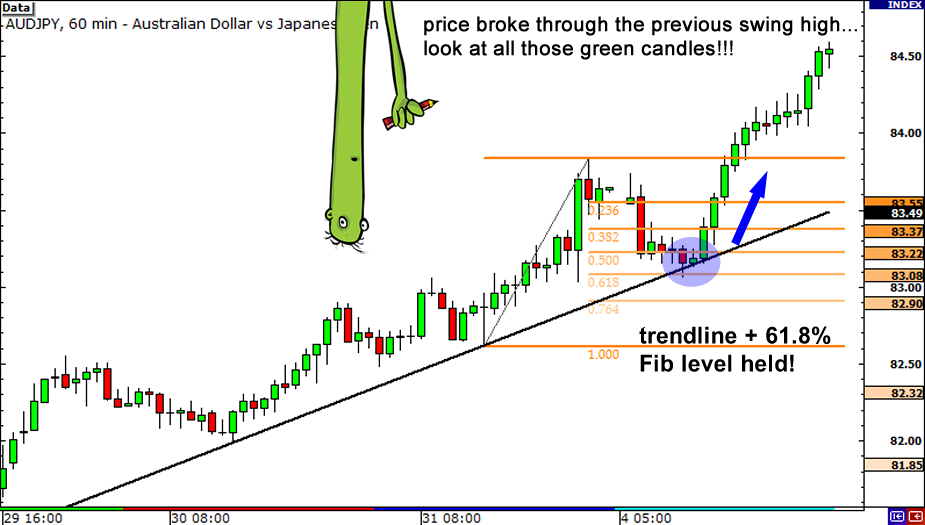
Image: kulyfyyepi.web.fc2.com
How Do You Use Fibonacci Retracement
Conclusion
Fibonacci retracement is a powerful technical analysis tool that provides valuable insights into market behavior. By understanding how to use Fibonacci retracement, traders can identify potential support and resistance levels, anticipate price movements, and make more informed trading decisions. While Fibonacci retracement is not a watertight predictive tool, it complements other technical indicators, adding rigor and depth to trading strategies. Harnessing the power of Fibonacci retracement can significantly enhance your trading prowess, enabling you to navigate the complexities of financial markets with greater confidence and precision.


